
Written by the Doctobip Editorial Team. Educational information only — not medical advice. See our Medical Disclaimer.
This complete guide to a1c vs blood sugar gives you clear, practical answers, the essentials worth knowing, and the questions people ask most. Everything is explained in plain, everyday language, so you can understand what matters and act on it today with real confidence.
Two numbers describe your blood sugar control: your daily readings and your A1C. They sound like they measure the same thing — but they tell different, complementary stories. Understanding both helps you and your care team see the full picture.
The quick difference
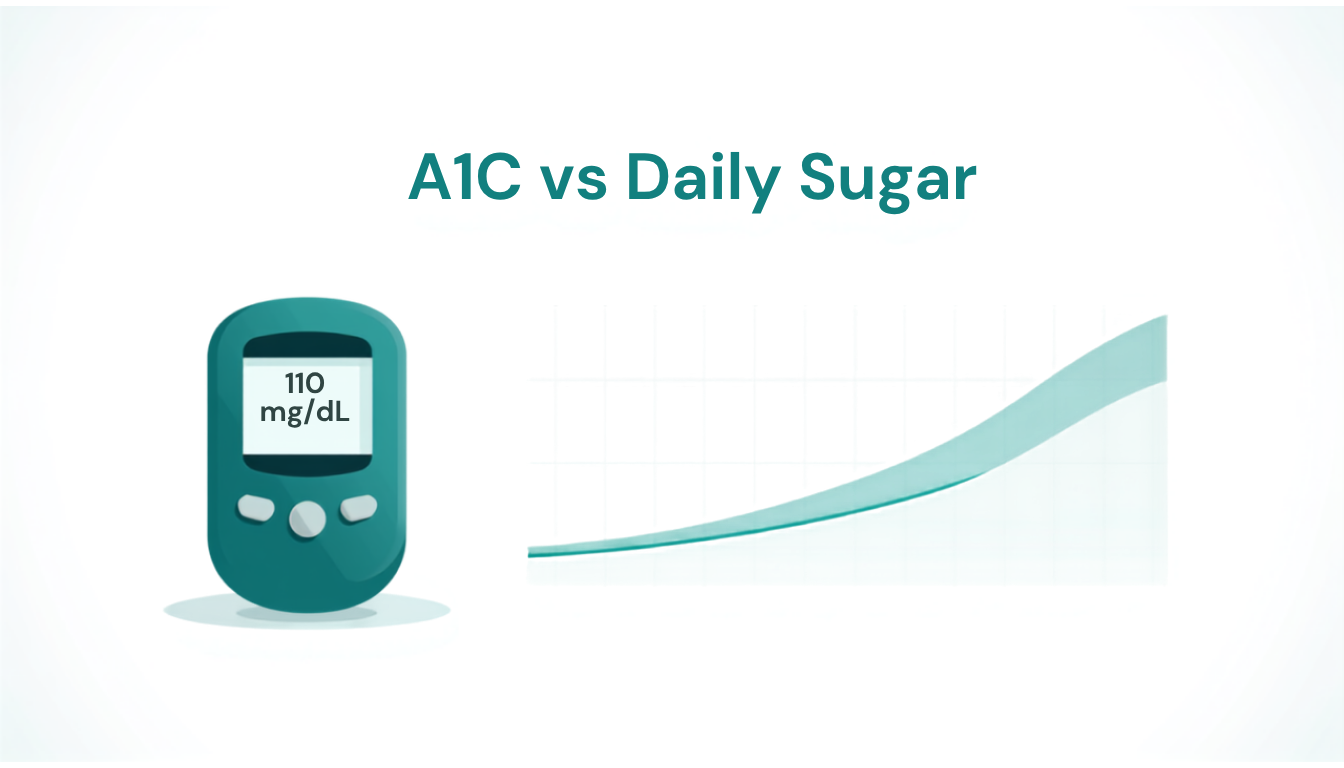
- Daily blood sugar (fingerstick or CGM) is a snapshot — where your glucose is right now, in mg/dL.
- A1C is an average — your typical blood sugar over the past 2–3 months, in %.
Think of daily readings as individual photos, and A1C as the highlight reel of the whole quarter.
Why you need both
A1C is powerful because it captures the long game — and lower A1C strongly links to lower complication risk. But an average can hide a lot. Two people can share an A1C of 7% while one is steady and the other swings between highs and lows all day. Daily readings reveal those swings; A1C smooths them out.
How they connect
Roughly, an A1C of 7% corresponds to an average glucose around 154 mg/dL; 6% ≈ 126 mg/dL; 8% ≈ 183 mg/dL. If your daily numbers look great but your A1C is higher than expected (or vice versa), tell your provider — it can point to missed patterns (like overnight highs) or a testing quirk.
What “time in range” adds
CGMs introduced a third, very useful view: time in range — the percentage of the day spent between 70 and 180 mg/dL. It bridges the gap, showing both the average and the swings. Many care teams now look at A1C, average glucose and time in range together.
- Daily readings = a snapshot; A1C = a 3-month average.
- You need both: A1C for the trend, daily numbers for the swings.
- “Time in range” (70–180 mg/dL) combines the best of both.
- If they don’t match up, mention it — it reveals hidden patterns.
Frequently asked questions
Which number should I focus on?
Both, for different reasons. Use daily readings to make day-to-day decisions; use A1C to track long-term progress with your provider.
Can my A1C be “good” but my control poor?
Yes — frequent highs and lows can average out to a decent A1C while still being risky. That’s why daily data matters.
How often is each measured?
Daily readings as your plan requires; A1C usually every 3–6 months. See our monitoring guide.
References
- American Diabetes Association — Understanding A1C
- CDC — cdc.gov/diabetes
- NIDDK — niddk.nih.gov
Putting A1C vs blood sugar into practice
The real value of A1C vs blood sugar comes from steady, day-to-day consistency. Keep A1C vs blood sugar simple: learn the essentials first, then build a routine that genuinely fits your life. If you ever feel stuck with A1C vs blood sugar, small adjustments usually beat big changes — and your care team can tailor A1C vs blood sugar to your personal needs.
A1C vs Blood Sugar: The Bottom Line
The best outcomes rarely come from dramatic overhauls — they come from small, consistent habits you can actually keep. Start by understanding what your key numbers mean, then agree on realistic targets that fit your daily life together with your care team. Keep a simple record of what you eat, how you move and how you feel, so patterns become clear and you can repeat what works. Prepare for the tricky moments in advance, and give yourself credit for steady progress rather than perfection. Above all, if something feels off or you are unsure, do not guess — reach out to a qualified healthcare professional. With reliable information and a routine that suits you, staying in control becomes far more manageable.
Helpful links
Medical disclaimer: This article is for general education and is not a substitute for professional medical advice. Always consult a qualified healthcare provider.